



TL;DR
A crypto bear market is generally described as a prolonged price decline, sometimes measured against a 20% threshold as a market convention rather than a fixed rule. Cryptocurrency has historically moved through patterns of expansion and contraction shaped by macroeconomics and sentiment, though these patterns are not guaranteed to repeat. Past cycles and on-chain metrics are descriptive only and do not predict future prices. Cryptocurrency markets are known for sharp expansions followed by steep, extended declines. For Canadian investors, understanding the mechanics behind these swings can help separate information from headlines. If you are new to digital assets, our beginner's guide to cryptocurrency is a useful starting point. Below, we look at what has driven past crypto bear markets, how cycles have been described, and the data used to study them.
What Is a Crypto Bear Market?
A crypto bear market is often described as a prolonged period of falling cryptocurrency prices. Some observers use a decline of 20% or more from recent highs as a general convention, a threshold borrowed from traditional equity markets, but there is no single agreed definition [Source].
Because digital assets can swing 20% even during strong uptrends, many analysts treat a genuine bear market as a broader shift in market structure rather than a single sharp drop: deteriorating fundamentals, shrinking liquidity, and sustained downward momentum that breaks long-term moving averages. How each of these is measured varies between analysts.
The term "crypto winter" is often used for the most severe and prolonged stages of a downturn. During past crypto winters, secondary effects piled up beyond falling prices. Venture funding slowed, protocol development slowed, and retail trading volume fell. The slowdown was visible on-chain, where transaction counts and network fees dropped as casual participants left [Source].
Bear markets have varied widely in depth and length. Past occurrences do not indicate how any future downturn will unfold, and every cycle carries the risk of significant loss.
How Market Cycles Work in Cryptocurrency
Cryptocurrency prices have historically moved through patterns of expansion and contraction, shaped by capital flows, global liquidity, and investor sentiment. Historically these swings have been shorter and more volatile than those in traditional fiat-based markets, though future cycles may differ [Source].
Financial markets rarely move in a straight line. Capital rotates between risk-on and risk-off conditions over time. In crypto, that movement has historically been faster and sharper, associated with the assets' digital nature, 24/7 global trading, and the speed at which news and sentiment travel across social platforms.
In past downturns, on-chain data has shown coins moving from short-term holders toward long-term holders, a cohort classification based on how long coins have gone without moving [Source]. This activity has sometimes coincided with reduced selling pressure. Near past peaks, the reverse occurred, with longer-term holders distributing coins to newer buyers. These are descriptions of past on-chain behaviour, not indicators of what will happen next.
External forces have been associated with the pace of past cycles, including global interest rates, the relative strength of currencies like the Canadian Dollar (CAD) and US Dollar (USD), and technology milestones. Periods when central banks such as the Bank of Canada or the US Federal Reserve tightened policy have sometimes coincided with weaker performance in risk assets, including crypto, though this is a historical association rather than a reliable cause-and-effect rule.
The Four Phases of a Crypto Market Cycle
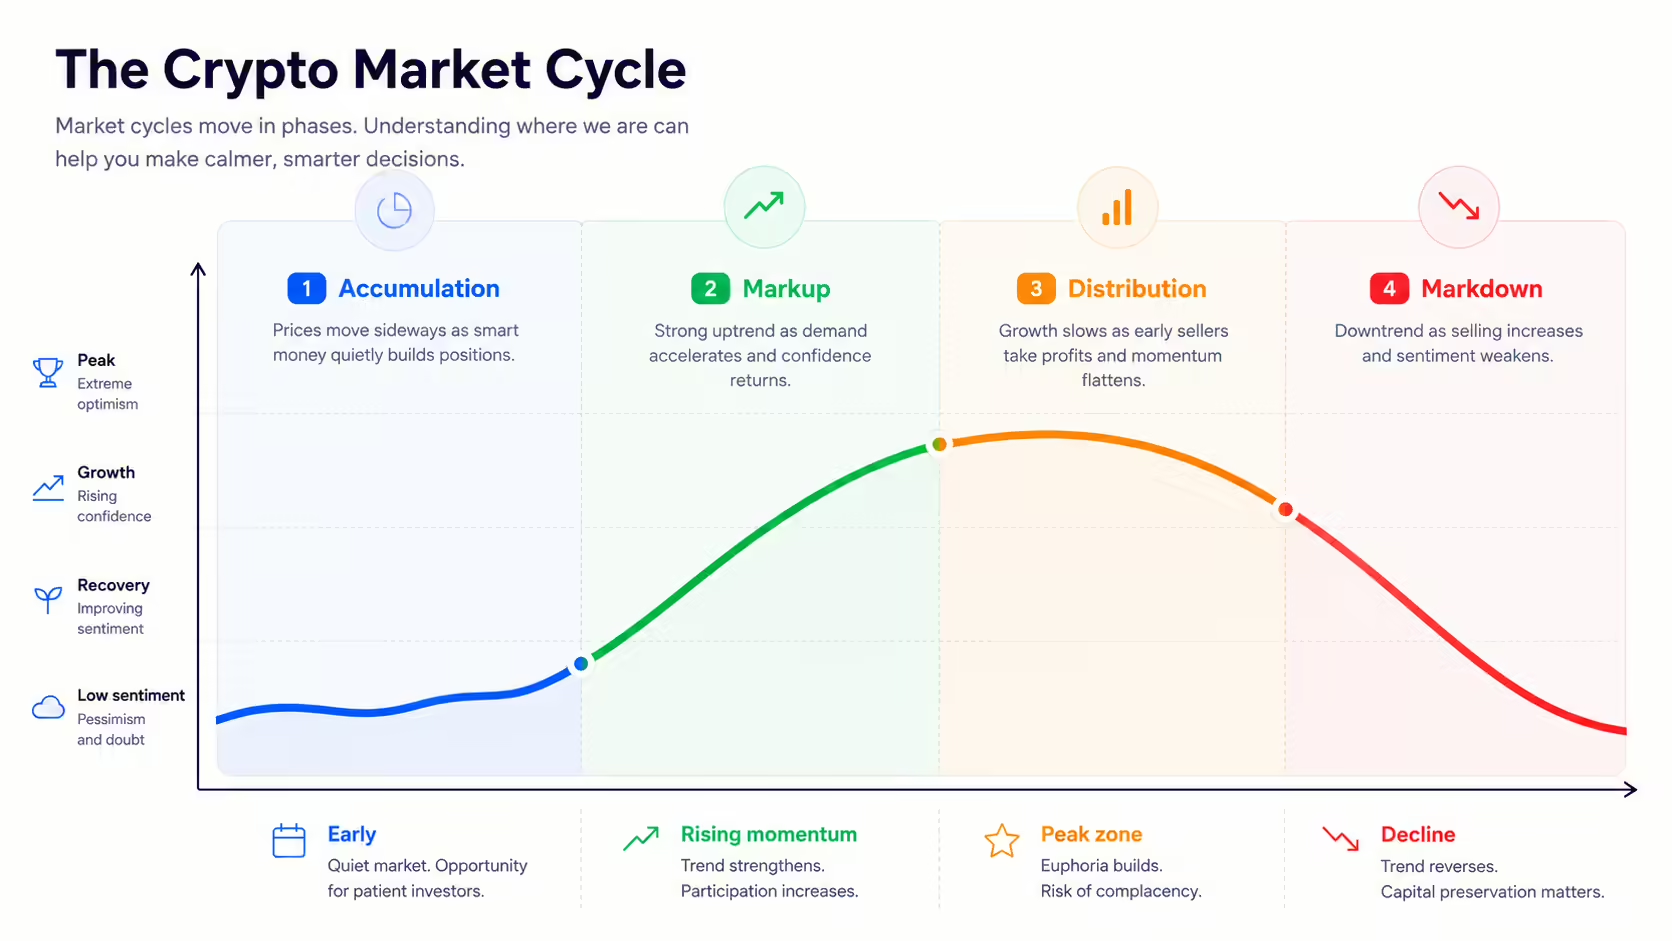
Analysts often describe past crypto cycles using a four-phase framework adapted from the Wyckoff model used in traditional equities [Source]. This is a historical analytical framework for describing what has happened, not a guaranteed or predictable sequence. Real markets rarely move through it cleanly, and the phases are generally identified only in hindsight.
Accumulation describes periods, usually recognized only after the fact, when prices had stopped falling sharply, volatility was low, and public interest was minimal. Trading activity was quieter, and media coverage tended to be negative or indifferent.
The Markup phase describes what is commonly called a bull market. In past cycles, as trading interest returned, prices rose, volumes increased, and sentiment shifted from caution toward optimism and, at times, euphoria. Mainstream coverage tended to peak late in this phase, coinciding with more new buyers entering at higher prices.
The Distribution phase describes periods after a long markup when valuations had become stretched. In past cycles, some earlier investors sold into strength, and prices often moved sideways with large swings before a market top formed.
The Markdown phase describes the bear market itself, when prices fell steeply and participants sold to preserve capital. Historically this has included panic selling, forced liquidations of leveraged positions, and broad capitulation. These labels are descriptive. They do not indicate where a current market sits or when a phase will change. For a Canadian holding a CAD-denominated balance, the framework can help make sense of past volatility, but it cannot tell you what happens next.
Historical Context: Examining Past Crypto Winters
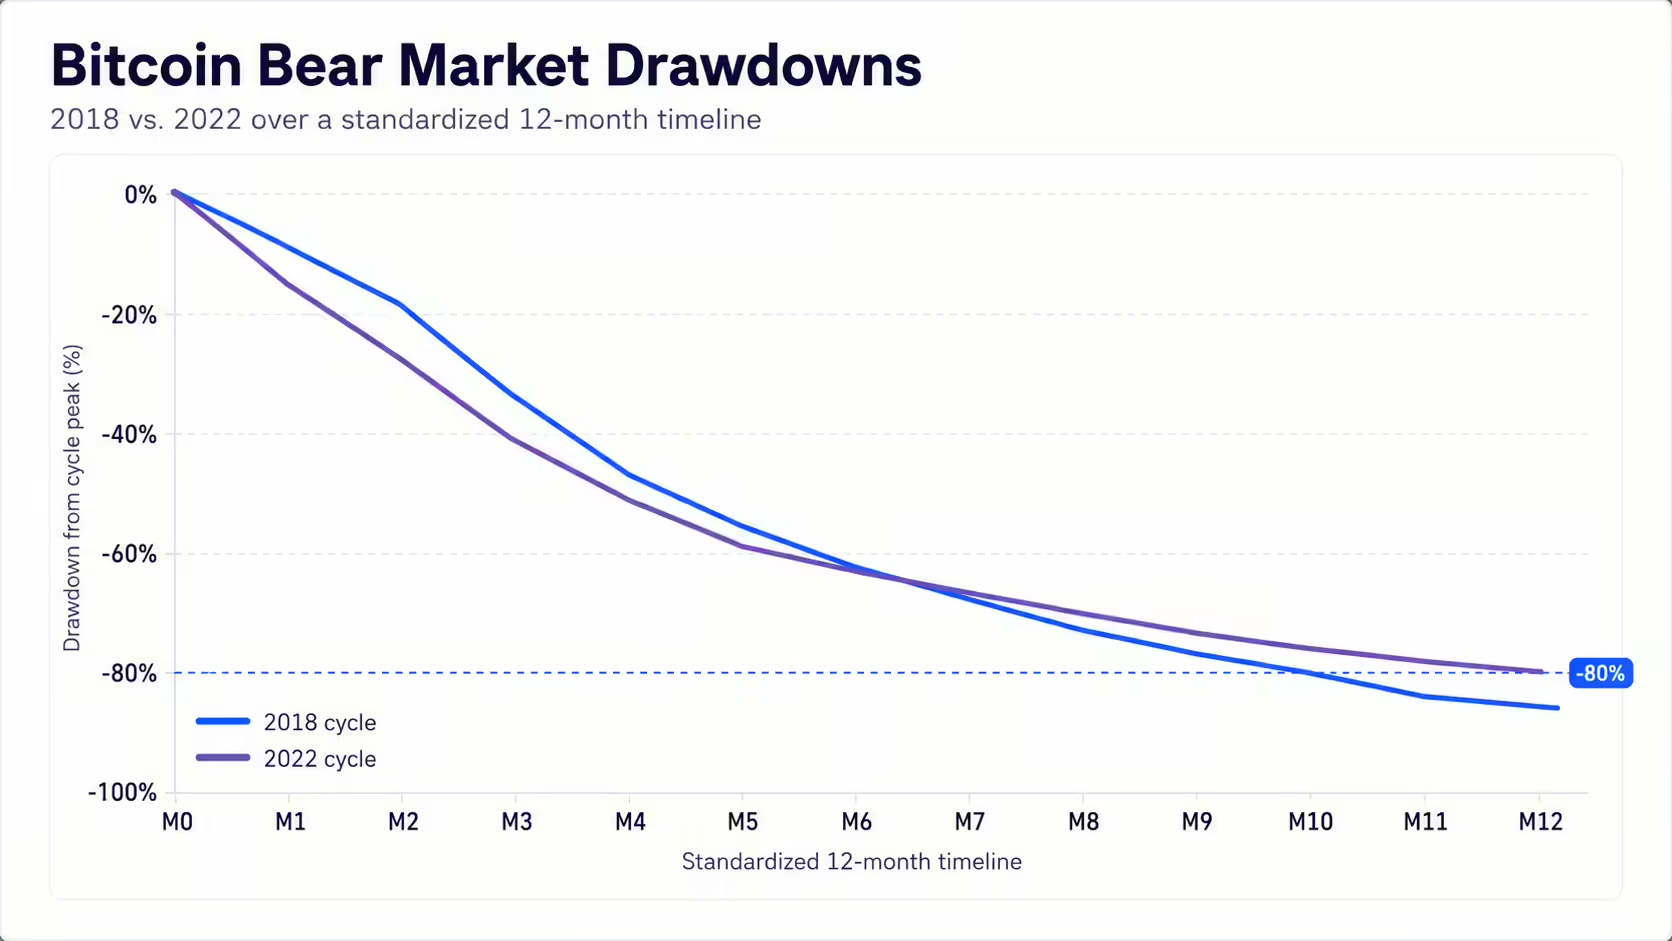
Every major cryptocurrency peak so far has been followed by a significant decline, and past bear markets erased a large share of market value before any recovery. The figures below are drawn from Glassnode and CoinMarketCap research. Different providers define cycle peaks and troughs using different methods, so exact percentages vary by source.
Looking at Bitcoin and Ethereum across past cycles gives context on how deep and how long previous winters ran:
- 2014 to 2015: Bitcoin fell roughly 84% from its cycle peak. Ethereum had not yet launched, so this cycle was Bitcoin-driven, and the downturn lasted well over a year [Source].
- 2017 to 2018: Bitcoin dropped about 84%. Ethereum fell roughly 94% over the same period, from about $1,396 to $86.54 between January and December 2018 [Source]. The decline is often associated with the collapse of the speculative Initial Coin Offering (ICO) bubble.
- 2021 to 2022: Bitcoin declined roughly 77% from its November 2021 peak near $69,000 to a low around $15,500. Ethereum fell about 81%, from roughly $4,812 to $896 [Source].
The 2022 downturn coincided with the failure of several major centralized lending platforms and exchanges [Source]. These figures describe past events only. They do not indicate that future downturns will be smaller, shorter, shallower, or safer, and any future cycle could involve larger losses. Canadian investors who held through these periods experienced the full extent of these declines in CAD terms.
Macroeconomic Shocks and Global Liquidity
Historically, crypto downturns have rarely been tied to a single isolated event. They have often coincided with broad macroeconomic shifts and tightening global liquidity. Although digital assets run on decentralized networks, their prices have moved alongside the traditional financial system, and past periods of cheap borrowing and abundant capital have often coincided with stronger risk-asset performance.
When central banks have raised interest rates to fight inflation, higher borrowing costs and reduced liquidity have sometimes coincided with weaker performance across risk assets, including technology stocks and crypto. Research from the International Monetary Fund found that US monetary policy has affected the crypto cycle in ways similar to global equities, rather than crypto acting as a pure hedge against traditional market risk [Source].
Currency strength has also been associated with these moves. Periods of sharp US Dollar strengthening against currencies like the Canadian Dollar have sometimes coincided with weaker crypto performance. For Canadians, crypto downturns have often occurred alongside broader pressure on risk assets, including the TSX, since similar liquidity conditions affect many markets at once. No single indicator reliably signals a market turn.
Structural Catalysts: Leverage and DeFi Liquidations
The internal structure of the crypto market, especially heavy use of leverage and decentralized finance protocols, can amplify moves during a downturn.
Leverage, or borrowed money, amplifies both gains and losses. In the Decentralized Finance (DeFi) ecosystem, users often take out loans overcollateralized by volatile assets like Ethereum. If the collateral's value falls below a defined threshold, automated smart contracts trigger forced liquidations [Source].
When an initial price drop pushes collateral below these thresholds, contracts begin selling that collateral on decentralized exchanges to repay debt. That selling can push prices lower and breach the thresholds of other borrowers, producing a cascading effect that adds sell orders to a falling market [Source].
The scale of this system grew quickly. Total value locked (TVL) in DeFi peaked around $184.5 billion before contracting sharply as investors withdrew from interconnected protocols during the 2022 downturn [Source]. Because the blockchain is transparent, large liquidation levels can be visible in advance, which has at times invited trading aimed at those levels. Leverage carries a high risk of loss. For everyday Canadian users funding accounts in CAD, one practical point is that avoiding leverage removes exposure to this particular cascade.
On-Chain Analytics: Studying Cycles With Data
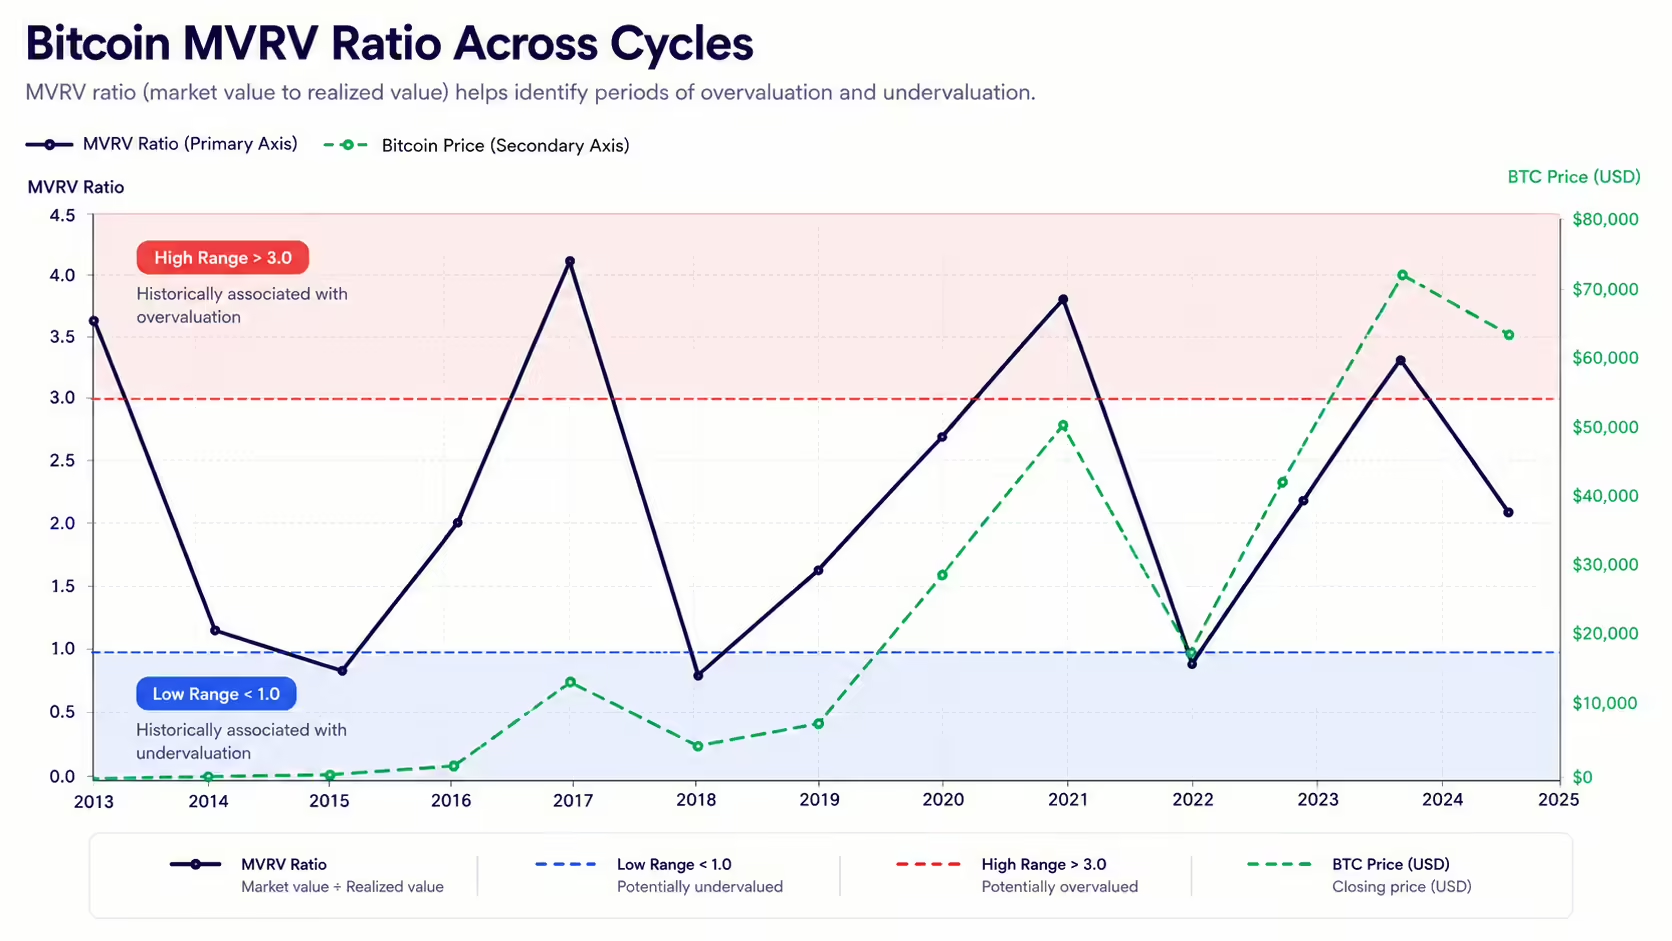
On-chain analysis reads public blockchain data to describe past market conditions, investor profitability, and network activity. Unlike traditional equities, where positioning is largely hidden, a public blockchain ledger records transactions openly. These are descriptive, historical metrics. They do not identify a market bottom or top, and they are not buy or sell signals.
One widely referenced tool is the Market Value to Realized Value (MVRV) ratio. It starts with Realized Price, which values every coin at the price it last moved on-chain rather than the current spot price, producing an aggregate cost basis [Source]. MVRV then compares current Market Value against that Realized Value [Source].
A high MVRV reading has historically corresponded to large aggregate unrealized profits. A reading below 1.0 means the average coin last moved at a higher price than the current price, so the typical holder is underwater. In past cycles, low readings appeared during deep declines [Source]. These observations describe the past. They do not indicate where prices will go and are not signals to act.
For any investor, including Canadians comparing on-chain data against headlines, these tools describe history and nothing more. They cannot forecast prices, they do not tell you whether a market has bottomed, and they should not be used to time purchases or sales.
Miner Capitulation and Network Hash Rate Dynamics
Bitcoin miners secure the network and process transactions in exchange for block rewards. Understanding how Bitcoin mining works helps explain why miner behaviour shows up in on-chain data during downturns.
Mining is capital-intensive. Miners balance Bitcoin-denominated revenue against fiat-denominated costs like electricity and hardware. When prices have fallen hard while energy costs stayed fixed, mining has at times become unprofitable [Source]. This pressure is relevant in Canada, where miners operating in provinces like Quebec and Alberta rely on hydro and natural gas power.
When margins have collapsed, some miners reduced operations and sold mined Bitcoin reserves to cover costs, activity sometimes called miner capitulation. In past declines this has appeared in on-chain indicators such as the Puell Multiple, which compares daily miner revenue to its 365-day average, and in a falling hash rate as machines are switched off [Source].
These are descriptive, historical indicators. They do not identify a market bottom, they do not confirm that a downturn is ending, and they are not buy or sell signals. Like other on-chain metrics, they describe conditions only after they have occurred.
Canadian Crypto Ownership Trends
Survey work from the Bank of Canada found that Bitcoin ownership in Canada rose from roughly 5% in the years leading into the pandemic to about 13% by 2021 [Source]. The Bank associated part of this increase with higher household savings and the arrival of easier-to-use platforms [Source].
This is ownership data covering a period that included both rising and falling prices. On its own, it does not indicate how Canadian investors behave, how they think about risk, or which platforms they prefer.
Whatever the market conditions, anyone considering how to buy Bitcoin in Canada can take practical steps before funding an account: verify whether a platform is registered with the applicable Canadian securities regulators, and review its custody arrangements, fees, and risk disclosures. Registration and security practices are worth confirming directly rather than assumed.
The Bitcoin Halving and Cyclical Theories
The Bitcoin protocol cuts the block reward paid to miners in half every 210,000 blocks, roughly every four years, in an event known as the halving. The first three halvings occurred on November 28, 2012 (50 to 25 BTC), July 9, 2016 (25 to 12.5 BTC), and May 11, 2020 (12.5 to 6.25 BTC) [Source].
In past cycles, these events were followed by periods of rising prices, though the timing varied widely and other factors were also at work. Past timing is not a guide to future results, and a halving does not guarantee any particular price outcome.
The influence of the halving is actively debated. Models like Stock-to-Flow (S2F) argue that programmed scarcity drives future value. Peer-reviewed analysis has criticized S2F for relying on statistically weak regressions and for ignoring the demand side of the equation [Source]. Under the Efficient Market Hypothesis, critics note that because the halving is fully public and mathematically fixed, rational markets should price it in well before it occurs [Source].
Some researchers also propose "lengthening cycles." As total market capitalization grows, it takes more capital to move prices, which may produce longer cycles with smaller percentage moves over time [Source]. For Canadian observers, the halving is often discussed in community and media coverage, but it remains a narrative topic, not a mechanism that guarantees any outcome.
Understanding Market Volatility

Investors approach crypto volatility in different ways. None of the approaches described below is a recommendation, and none removes the risk of loss.
One frequently discussed approach is dollar-cost averaging (DCA): buying a fixed amount of an asset at regular intervals, such as weekly or monthly, regardless of price. DCA spreads purchases over time. It does not necessarily lower your average purchase price, it does not protect against losses, and it does not guarantee a positive return. In a sustained decline, a position built through DCA can still lose value.
Counterparty and platform risk are also worth understanding. Past bear markets exposed fragile business models and led to the collapse of some exchanges and lenders, and fraud can increase during these periods, so it is worth reviewing the common crypto scams in Canada. Before funding an account, users can verify whether a platform is registered with the applicable Canadian securities regulators and review its custody, fees, and risk disclosures. No platform removes crypto's underlying volatility or risk. If you want to see how platforms differ, our comparison of Canadian crypto platforms is one reference point.
A downturn can also be a time to learn. With less market noise, it can be easier to study how blockchains work, how macro conditions interact with markets, and how different assets have behaved. This kind of research is educational and does not indicate a good or bad time to buy or sell.
People Also Ask About Crypto Bear Markets
How long have past crypto bear markets lasted? In past cycles, major crypto bear markets ran roughly 9 to 14 months from the price peak to the eventual low [Source]. The 2018 and 2022 declines each ran close to a year from peak to trough. These are historical observations only. Future cycles may be longer, shorter, or different in shape, and there is no way to know a downturn's length while it is happening.
Is it safe to buy crypto in a bear market? No crypto purchase is "safe." Buying during a downturn carries the real risk of further declines, and you could lose some or all of your capital. Whether crypto suits you at all depends on your own circumstances, risk tolerance, and time horizon, which is why many people consult a qualified professional. This is educational information, not a recommendation to buy, sell, or hold.
How have past crypto winters ended? Looking back, past downturns eased only gradually, and the turning points were clear only in hindsight. In some past cycles, realized losses stabilized and prices eventually traded back above long-term averages before a sustained recovery [Source]. These are backward-looking observations, not signals. There is no reliable way to identify a market bottom in real time, and no indicator predicts a recovery.
Do altcoins always survive crypto bear markets? Outcomes have varied widely. In past bear markets, some altcoins lost most or all of their value permanently, while others recovered. Even large, highly liquid assets have experienced substantial losses. Past outcomes do not indicate which assets will hold value in any future downturn, and no asset is guaranteed to recover.
Why has Bitcoin's price often moved the broader market? Bitcoin has historically held the largest share of the crypto market's value, recognition, and trading liquidity. Because many trading pairs are priced against Bitcoin, when macro forces have pushed it lower, smaller assets have often followed, sometimes with larger percentage moves [Source]. This describes past behaviour and is not a prediction of future correlation.
Frequently Asked Questions
What is the difference between a market correction and a bear market? A correction is generally described as a short-term drop of about 10% to 20% that interrupts an uptrend. A bear market is generally described as a longer, deeper decline, sometimes measured against a 20% threshold, accompanied by a broader negative shift in sentiment and liquidity [Source]. Neither has a single agreed definition, and the difference is about duration and structure more than the exact size of the drop.
Can a crypto asset lose all of its value? Yes. Any crypto asset can lose value, and some have gone to zero, including individual tokens and poorly designed algorithmic stablecoins. Large, highly liquid assets have also experienced very large losses in past downturns. No crypto asset is guaranteed to retain value, and outcomes have varied significantly from one asset and cycle to the next.
How does decentralized finance (DeFi) impact market crashes? DeFi platforms rely on smart contracts that automatically liquidate overleveraged loans when collateral values fall too low [Source]. During a sharp decline, these forced liquidations can add sell orders to decentralized exchanges, which can deepen a fall in a cascading loop [Source]. Because these systems are transparent, large liquidation levels can be visible in advance.
What on-chain metrics do analysts use to study past cycles? Analysts have used metrics such as the MVRV ratio, realized price, the Puell Multiple, and network hash rate to describe past market conditions [Source]. These are descriptive, historical tools [Source]. They do not identify a market bottom or top, they are not buy or sell signals, and they do not predict future prices.
What should someone check before using a crypto platform? Before funding an account, users can verify whether a platform is registered with the applicable Canadian securities regulators and review its custody arrangements, fees, and risk disclosures. Familiar domestic funding methods like Interac e-Transfer are one option to look for. No platform can remove crypto's underlying volatility and risk, so platform choice is only one part of managing that risk.
Quick Glossary
Accumulation: A label for periods, generally identified only in hindsight, when prices had stopped falling sharply, volatility was low, and public interest was minimal.
Capitulation: A label for episodes during severe past declines when many holders sold at a loss. It describes past behaviour and does not mark a bottom in real time.
Dollar-Cost Averaging (DCA): Making regular, scheduled purchases regardless of price. It spreads purchases over time but does not necessarily lower the average purchase price, protect against losses, or guarantee a positive return.
Hash Rate: The total computing power actively used to mine blocks and process transactions on a Proof-of-Work blockchain.
Liquidity: The ease and speed with which an asset can be bought or sold without causing a large, immediate change in its price.
MVRV Ratio: A descriptive on-chain metric comparing a cryptocurrency's spot market capitalization to its realized capitalization. It describes past conditions and is not a buy or sell signal.
Realized Price: The average price at which all units of a cryptocurrency last moved on-chain, representing an aggregate cost basis.
Smart Contract: Self-executing code deployed on a blockchain that automatically enforces the terms of an agreement without a traditional intermediary.
Key Takeaways
- A crypto bear market is generally described as a prolonged price decline, sometimes measured against a 20% threshold as a market convention rather than a fixed definition. Downturns can be long, and losses can be significant.
- Cryptocurrency has historically moved through patterns of expansion and contraction, often described using a four-phase framework. This framework describes the past and is not a guaranteed or predictable sequence.
- Past Bitcoin bear markets ran roughly 9 to 14 months with large drawdowns, but exact figures vary by source and past cycles do not indicate the timing, depth, or severity of any future downturn.
- On-chain metrics like the MVRV ratio, hash rate, and miner-capitulation indicators are descriptive, historical tools. They do not identify a market bottom and are not buy or sell signals.
- No strategy removes risk. Dollar-cost averaging spreads purchases over time but does not guarantee a lower average price, protect against losses, or guarantee a return. Verifying a platform's registration, custody, fees, and risk disclosures is one practical step among many.
Closing
Understanding how past bear markets and cycles have worked can help put crypto volatility in context. The four-phase framework, historical drawdowns, and on-chain metrics all describe the past. None predicts future prices, and none indicates a good or bad time to buy or sell. If you want to understand how buying Bitcoin in Canada works as a process, our step-by-step guide to buying Bitcoin in Canada explains it. This article is educational and is not a suggestion to buy during a downturn or at any other time.

About Netcoins
Established in 2014 in Vancouver, British Columbia, Netcoins is a registered Restricted Dealer with the provincial securities commissions and a registered Money Services Business (MSB) with FINTRAC. Netcoins is owned by Surge Digital Inc. (formerly BIGG Digital Assets Inc.), a publicly traded company listed on the TSX Venture Exchange (TSXV: SRGE), and complies with applicable public company regulatory.
The information provided in the blog posts on this platform is for educational purposes only. It is not intended to be financial advice or a recommendation to buy, sell, or hold any cryptocurrency. Always do your own research and consult with a professional financial advisor before making any investment decisions. Cryptocurrency investments carry a high degree of risk, including the risk of total loss. The blog posts on this platform are not investment advice and do not guarantee any returns. Any action you take based on the information on our platform is strictly at your own risk. The content of our blog posts reflects the authors’ opinions based on their personal experiences and research. However, the rapidly changing and volatile nature of the cryptocurrency market means that the information and opinions presented may quickly become outdated or irrelevant. Always verify the current state of the market before making any decisions.

.png)


